About SCREEN
SCREEN (Search Candidate Regulatory Elements by ENCODE) is a web-based visualization engine designed to allow users to explore and visualize the ENCODE Registry of candidate cis-Regulatory Elements (cCREs) and its connection with other ENCODE Encyclopedia annotations.
The ENCODE Encyclopedia
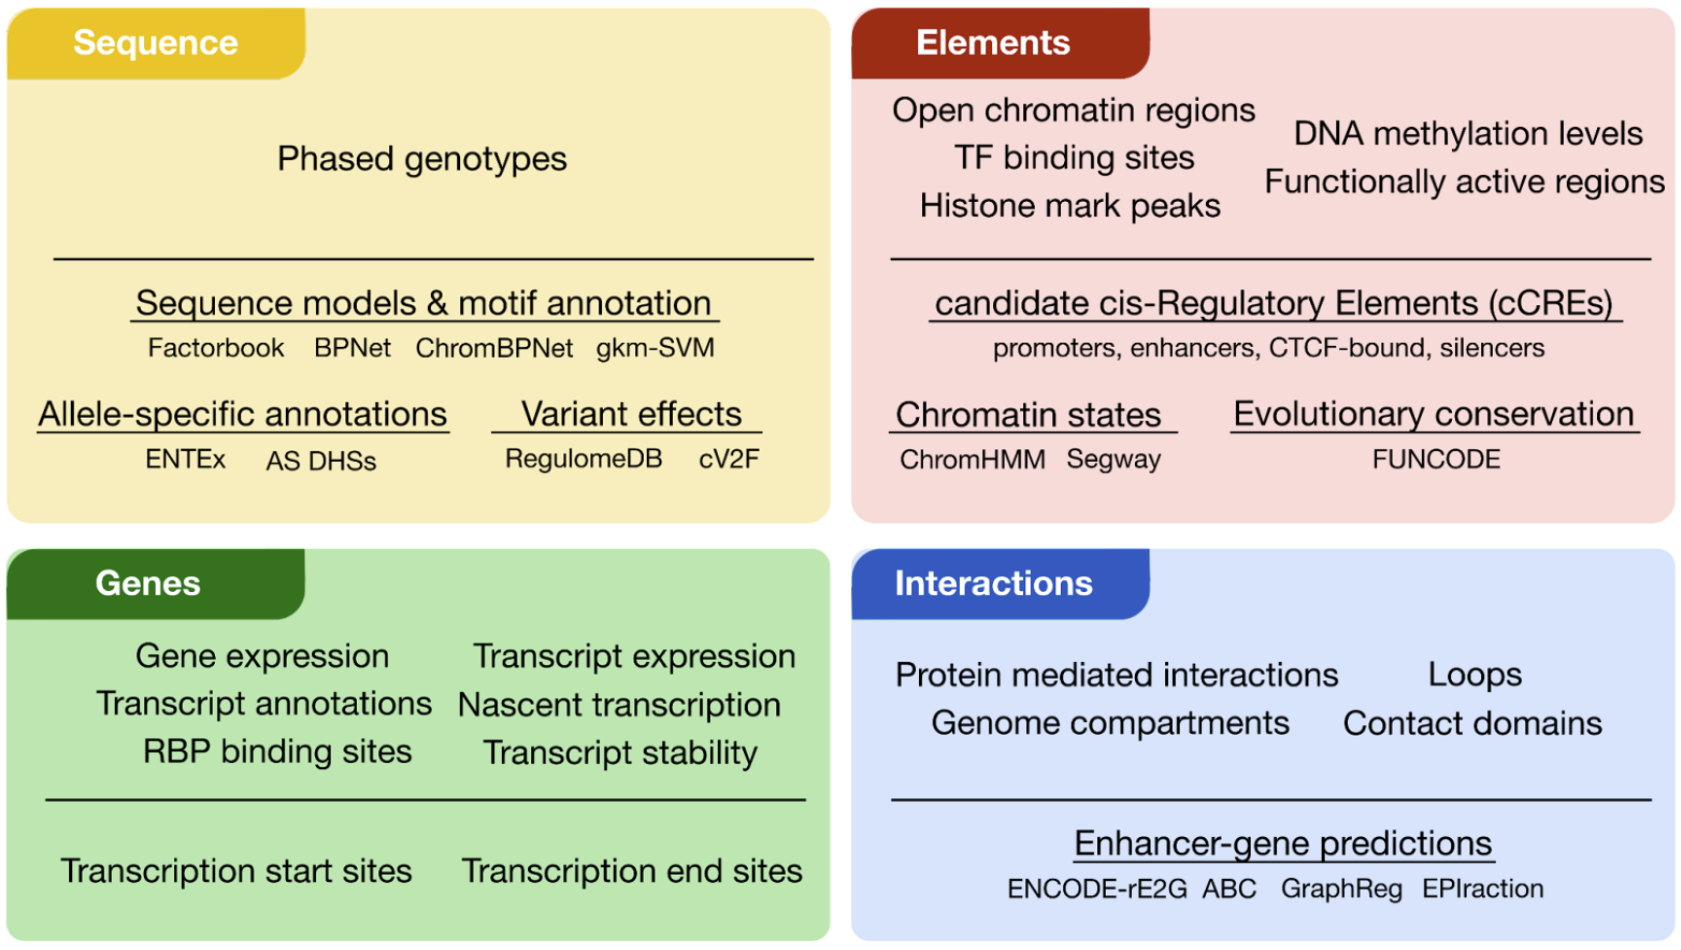
The ENCODE Encyclopedia encompasses a comprehensive set of sequence (yellow), element (red), gene (green) and interaction (blue) annotations (Figure 1). These annotations can either derive directly from primary data (primary level) or derive from the integration of multiple data types using innovative computational methods (integrative level).

The Registry of cCREs
Defining element anchors
Previous versions of the Registry of cCREs were anchored on representative DNase Hypersensitivity Sites (rDHSs), regions that represent open chromatin sites across hundreds of cell and tissue types. In version 4, we combined over 178 million DHSs from across 1,438 DNase profiles to generate a set of 2.8 million rDHSs in human and 54 million DHSs from across 466 DNase profiles to generate a set of 1.3 million rDHSs in mouse.
While these rDHSs account for the majority of biochemically active sites surveyed by the ENCODE project, there are specific transcription factors whose peaks have low overlap with open chromatin sites. These non-rDHS transcription factor binding sites are reproducible across cell types, contain high quality binding motifs, and are evolutionarily conserved. We hypothesize that these regions may have important regulatory activities and should be included as candidate cis-regulatory elements in our collection. Therefore, in version 4 of the Registry, we expanded our element anchoring scheme to also include reproducible transcription factor binding sites (which we refer to as transcription factor clusters). This resulted in an additional 86,748 element anchors in human and 7,658 anchors in mouse not previously captured by rDHSs.
Additionally, our analysis found that cCREs in recently duplicated genomic regions were underrepresented in previous versions of the Registry because ENCODE uniform processing pipelines filter out multi-mapping reads. To fill in these gaps, we called DHSs from multi-mapping-inclusive alignments, which we used to generate a complementary set of multi-mapper rDHSs, 24,526 in human and 40,684 in mouse.
Defining high epigenomic signals
For each anchor, we computed the Z-scores of the log10 of DNase, ATAC, H3K4me3, H3K27ac, and CTCF signals in each biosample with such data. Z-score computation is necessary for the signals to be comparable across biosamples because the uniform processing pipelines for DNase-seq and ChIP-seq data produce different types of signals. The DNase-seq signal is in sequencing-depth normalized read counts, whereas the ChIP-seq signal is the fold change of ChIP over input. Even for the ChIP-seq signal, which is normalized using a control experiment, substantial variation remains in the range of signals among biosamples.
To implement this Z-score normalization, we used the UCSC tool bigWigAverageOverBed to compute the signal for each rDHS for a DNase, H3K4me3, H3K27ac, or CTCF experiment. For DNase and CTCF, the signal was averaged across the genomic positions in the rDHS. The signals of H3K4me3 and H3K27ac were averaged across an extended region—the rDHS plus a 500-bp flanking region on each side—to account for these histone marks at the flanking nucleosomes. We then took the log10 of these signals and computed a Z-score for each rDHS compared with all other rDHSs within a biosample. rDHSs with a raw signal of 0 were assigned a Z-score of -10. For all analyses we defined "high signal" as a Z-score greater than 1.64, a threshold corresponding to the 95th percentile of a one-tailed test. We define a max-Z of a rDHS as the maximum z-score for a signal across all surveyed biosamples.
Classification of cCREs
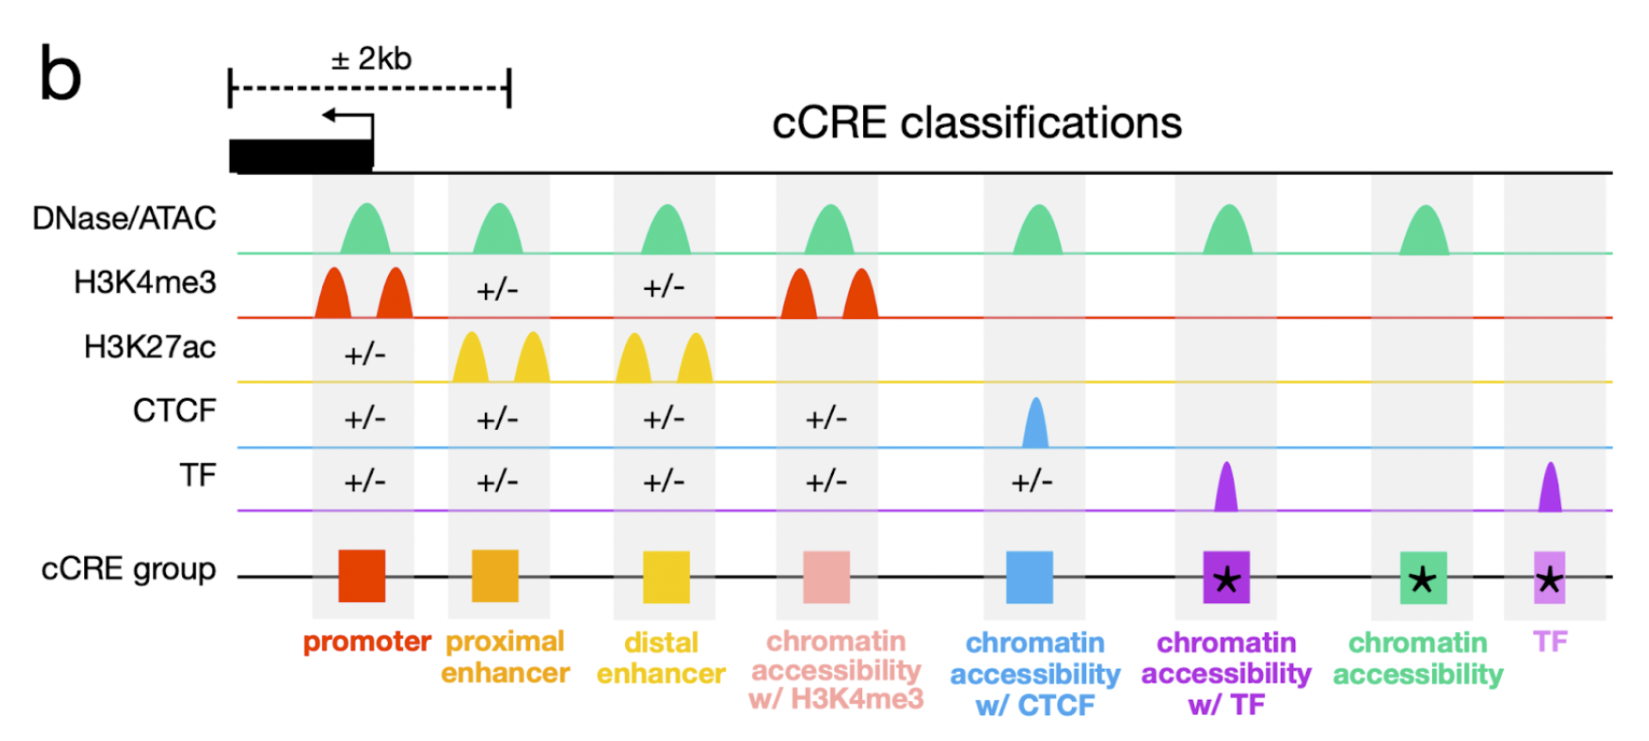
Many uses of cCREs are based on the regulatory role associated with their biochemical signatures. Analogous to GENCODE's catalog of genes, which are defined irrespective of their varying expression levels and alternative transcripts across different cell types, we provide a general, cell type-agnostic classification of cCREs. This classification is based on each element's dominant biochemical signals across all available biosamples and its proximity to the nearest GENCODE transcription start site (TSS) (Figure X).

Enhancer-like signatures (enhancer) have high chromatin accessibility and H3K27ac signals. If they are within 200 bp of a TSS they must also have low H3K4me3 signal. The subset of the enhancers within 2 kb of a TSS are denoted as TSS proximal (proximal enhancers), while the remaining subset is denoted TSS distal (distal enhancers).
Chromatin accessibility + H3K4me3 (CA-H3K4me3) have high chromatin accessibility and H3K4me3 signals, low H3K27ac signals and do not fall within 200 bp of a TSS.
Chromatin accessibility + CTCF (CA-CTCF) have high chromatin accessibility and CTCF signals, low H3K4me3 and H3K27ac signals.
Chromatin accessibility + transcription factor (CA-TF) have high chromatin accessibility, low H3K4me3 H3K27ac, and CTCF signals, and overlap a transcription factor cluster.
Chromatin accessibility (CA) have high chromatin accessibility, and low H3K4me3, H3K27ac, and CTCF signals.
Transcription factor (TF) have low chromatin accessibility, H3K4me3, H3K27ac, and CTCF signals and overlap a transcription factor cluster.
In addition to the cell type-agnostic classification described above, we also evaluated the biochemical activity of each cCRE in individual biosamples using the corresponding biosample-specific DNase, H3K4me3, H3K27ac, and CTCF data. This allows us to annotate active cCREs in individual biosamples including promoter, enhancer, CA-H3K4me3, CA-CTCF, and CA cCREs. Elements with low DNase Z-scores in individual biosamples are deemed to be inactive and are labeled with “Low Chromatin Accessibility.”
Because of the uneven distribution of TF data across biosamples and our desire to reduce false positive annotations, we do not specifically annotate the TF class of elements in individual cell types. We instead provide an aggregate list of these TF cCREs annotated with their supporting TF ChIP-seq peaks. For cell types with TF ChIP-seq data, we annotate CA-TF elements since the accessible chromatin corroborates the TF binding.
Core Collection
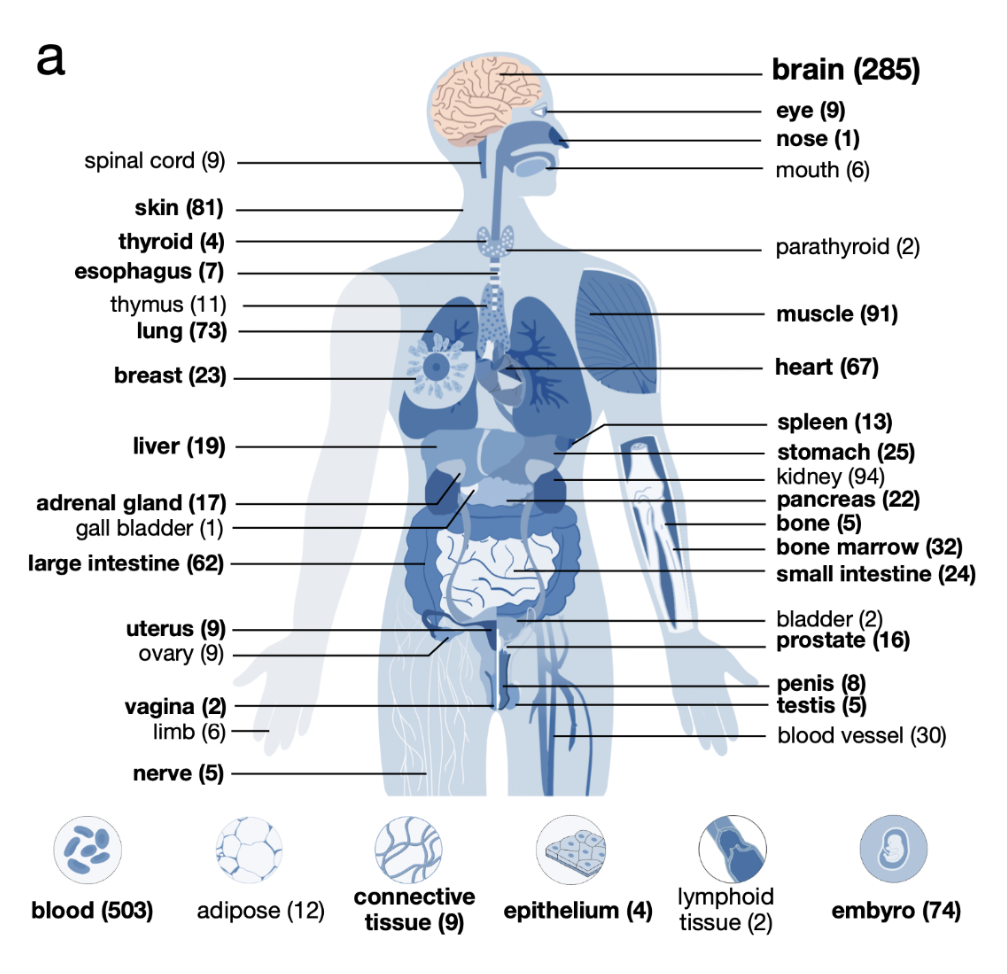
Thanks to the extensive coordination efforts by the ENCODE4 Biosample Working Group, 171 biosamples have DNase, H3K4me3, H3K27ac, and CTCF data. We refer to these samples as the biosample-specific Core Collection of cCREs. These samples cover a variety of tissues and organs and primarily comprise primary tissues and cells. We suggest that users prioritize these samples for their analysis as they contain all the relevant marks for the most complete annotation of cCREs.

Partial Data Collection
To supplement this Core Collection, 1,154 biosamples have DNase in addition to various combinations of the other marks (but not all three). Though we are unable to annotate the full spectrum of cCRE classes in these biosamples, having DNase enables us to annotate element boundaries with high resolution. Therefore, we refer to this group as the Partial Data Collection. In these biosamples, we classify elements using the available marks. For example, if a sample lacks H3K27ac and CTCF, its cCREs can only be assigned to the promoter, CA-H3K4me3, and CA groups, not the enhancer or CA-CTCF groups. The Partial Data Collection contains some unique tissues and cell states that are not represented in the Core Collection, such as fetal brain tissue and stimulated immune cells that may be of high interest to some researchers. Therefore, if users are interested in cCRE annotations in such biosamples, we suggest leveraging the cell type-agnostic annotations or annotations from similar biosamples in the Core Collection, to supplement their analyses.
Ancillary Collection
For the 563 biosamples lacking DNase data, we do not have the resolution to identify specific elements and we refer to these annotations as the Ancillary Collection. In these biosamples, we simply label cCREs as having a high or low signal for every available assay. We highly suggest that users do not use annotations from the Ancillary Collection unless they are anchoring their analysis on cCREs from the Core Collection or Partial Data Collection.
In both SCREEN’s visualization tools and downloadable files, we annotate biosamples based on their collection and available data.
Custom Classification
While our classification schemes place each cCRE into specific, individual classes, the signal strengths for all recorded epigenetic features are retained for each cCRE in the Registry and can be used for customized searches by users. For example, users may want promoters that have high DNase, H3K4me3, and H3K27ac to distinguish from poised promoters that often lack H3K27ac signal.
Additionally, by default, all chromatin accessibility annotations use DNase signal. If users prefer to use ATAC signal, this can be easily accomplished using the ENCODE API.
Integration with other encyclopedia annotations
In addition to hosting the Registry of cCREs, SCREEN also hosts other Encyclopedia annotations and displays them in the context of cCREs. Under the cCRE Details page for each cCRE are tabs displaying overlapping Encyclopedia annotations with links to their derived experiments or annotations. Such annotations include TF peaks, histone mark peaks, ChromHMM states, TSS derived from RAMPAGE and long read RNA-seq data, 3D chromatin interactions, and gene expression.
How to Cite the ENCODE Encyclopedia, the Registry of cCREs, and SCREEN
The Registry of cCREs and SCREEN
The ENCODE Project Consortium, Jill E. Moore, Michael J. Purcaro, Henry E. Pratt, Charles B. Epstein, Noam Shoresh, Jessika Adrian, et al. 2020. “Expanded Encyclopaedias of DNA Elements in the Human and Mouse Genomes.” Nature 583 (7818): 699–710.
The ENCODE Encyclopedia
The ENCODE Project Consortium, Jill E. Moore, Michael J. Purcaro, Henry E. Pratt, Charles B. Epstein, Noam Shoresh, Jessika Adrian, et al. 2020. “Expanded Encyclopaedias of DNA Elements in the Human and Mouse Genomes.” Nature 583 (7818): 699–710.
API Documentation
SCREEN API DocumentationContact Us
Send us a message and we'll be in touch!
As this is a beta site, we would greatly appreciate any feedback you may have. Knowing how our users are using the site and documenting issues they may have are important to make this resource better and easier to use.
If you're experiencing an error/bug, feel free to
submit an issue on Github.If you would like to send an attachment, feel free to email us directly at
encode‑screen@googlegroups.com